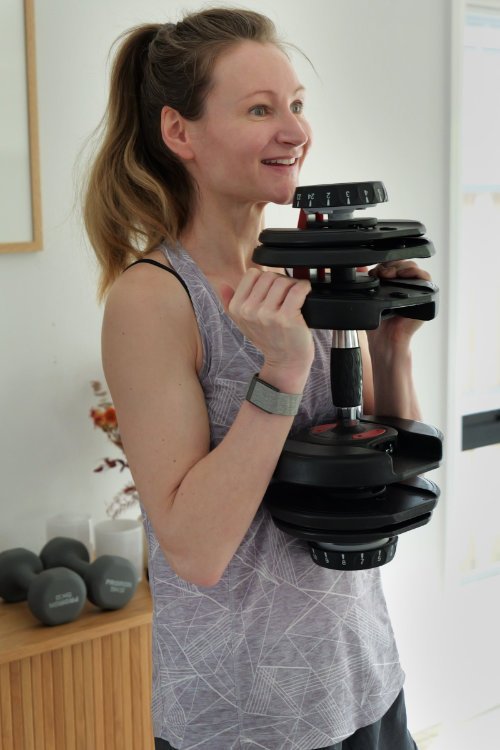
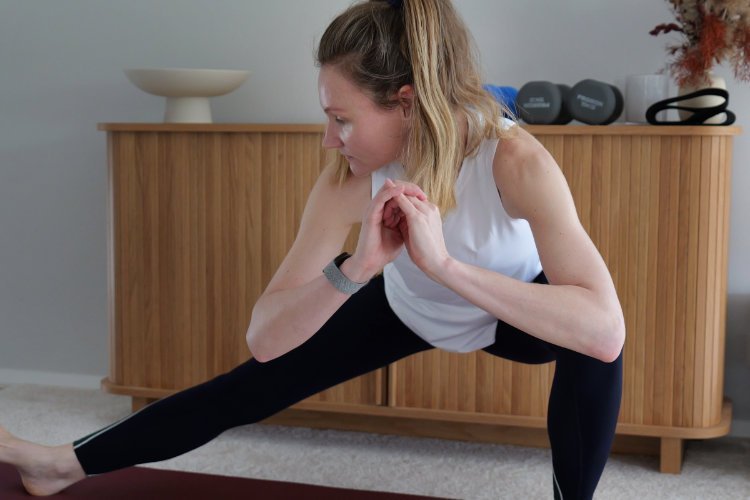
The same basic lifestyle changes I now coach around have significantly improved my own health markers.

Health Markers
| Biomarker | Mine | Standard Clinical Range | Personal Optimal Range | Category | Why It Matters for Longevity |
|---|---|---|---|---|---|
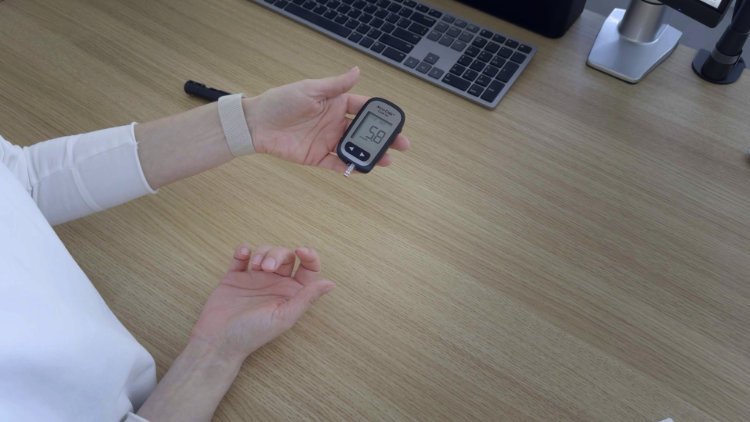
| Fasting glucose | 4.6 | <5.6 | 3.9-4.7 | Metabolic | Higher fasting glucose is linked to higher future risk of type 2 diabetes and cardiovascular disease. Lower-normal levels usually mean better insulin control. |
| Fasting Insulin | 3 | ~2-25 (varies widely) | 2-5 | Metabolic | Shows how much insulin your body needs to keep glucose normal. Higher fasting insulin can be an early sign your metabolism is working harder than it should (often before glucose rises). |
| HbA1c | 5.0 | <5.7 | 5.0-5.4 | Metabolic | Your average glucose exposure over ~2–3 months (includes fasting, after meals, and overnight). Higher A1c is linked to higher long-term risk for diabetes and vascular damage. |
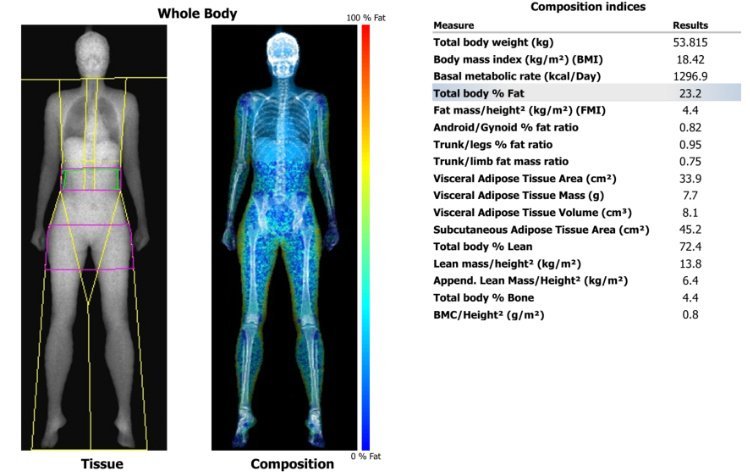
| Visceral fat | 33.9 | <100 | as low as possible | Metabolic | Visceral fat (around the organs) is strongly linked to insulin resistance, fatty liver, inflammation, and higher cardiometabolic disease risk (even in people who look lean). |
| Triglycerides | 0.5 | <1.7 | <0.9 | Cardiovascular | A fast-moving marker of how well your body handles carbs and fats. Higher triglycerides are linked to insulin resistance and higher cardiovascular risk. Lower levels usually reflect better metabolic health. |
| LDL-C | 2.1 | <2.6 | <2.0 | Cardiovascular | LDL is one of the main drivers of plaque build-up in arteries. Keeping LDL lower over many years reduces lifetime risk of heart attack and stroke. |
| HDL-C | 1.7 | >1.3 (women) | 1.3-2.3 | Cardiovascular | Helps transport cholesterol away from arteries. Low levels are linked to higher cardiovascular risk. Very high levels aren’t always protective. Mid-range levels tend to reflect a healthier profile. |
| Blood Pressure | 119/75 | <120/80 | <120/80 | Cardiovascular | Higher blood pressure increases wear and tear on artery walls over time. Keeping it in a healthy range lowers long-term risk of heart disease, stroke, and kidney strain. |
| ApoB | 0.8 | <0.9 | <0.6 | Cardiovascular | Estimates how many “plaque-forming” particles are in your blood. Higher ApoB is strongly linked to higher cardiovascular risk—often more directly than LDL-C alone. |
| hs-CRP | 0.21 | <1.0 | <0.3 | Inflammation | A broad marker of low-grade inflammation. Persistently higher hs-CRP is linked to higher cardiovascular risk and faster health decline; lower levels usually reflect lower inflammatory burden. |
| ALT | <8 | 7-55 | <17 | Liver | Key liver health marker. High levels often correlate with metabolic conditions such as T2D and non-alcoholic fatty liver disease (NAFLD). |
| AST | 13 | 8-48 | <17 | Liver | Elevated levels may reflect liver or muscle stress and are associated with increased health risk in population studies. |
| GGT | 15 | 8-61 | <14 to 20 (women) | Liver | Oxidative stress marker. Elevated levels are linked with a higher risk of T2D, CVD, and all-cause mortality. |
| VO₂ max (Whoop)* | 46 | No official cutoff | 45-47+ | Fitness | One of the strongest predictors of long-term health and lifespan. Higher VO₂ max reflects better heart-lung fitness and how efficiently your body uses oxygen. |
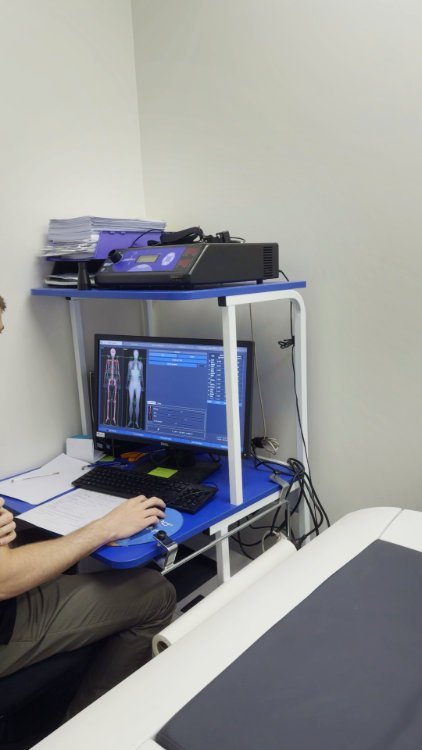
| Lean mass (%) | 72.4 | No official cutoff | >70-75 (women) | Body Composition | More lean mass (especially muscle) supports strength, glucose control, and resilience with aging. Higher muscle is linked to lower frailty risk and better long-term health. |
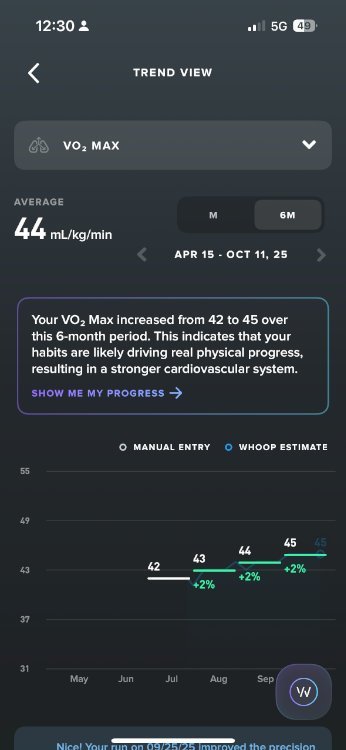
*While my VO₂ max is estimated by Whoop rather than lab tested, it offers a solid approximation of my cardiorespiratory fitness for my age and sex. Within the first three months of aerobic training, I saw it rise from 42 to 45.
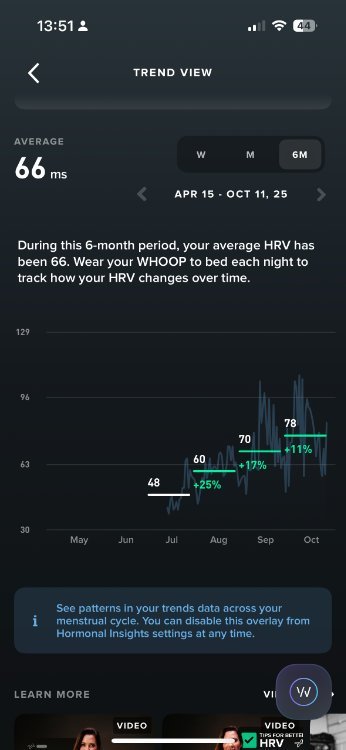
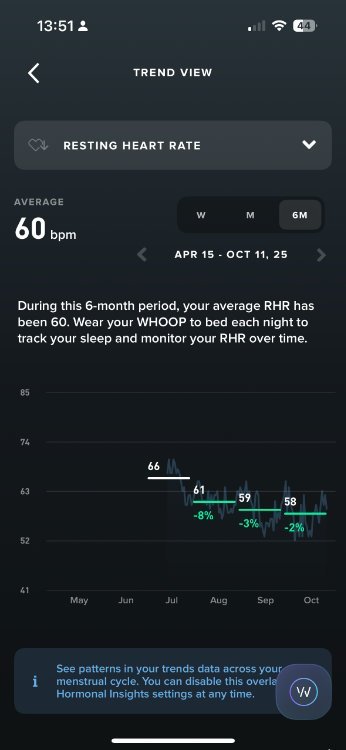
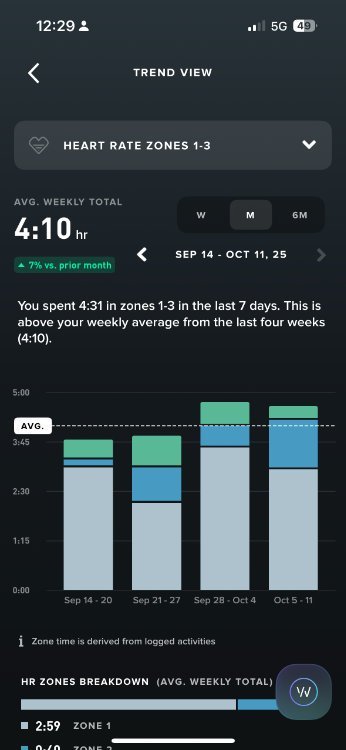
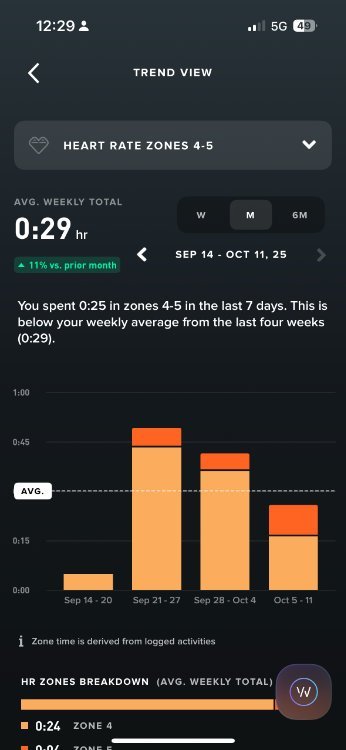
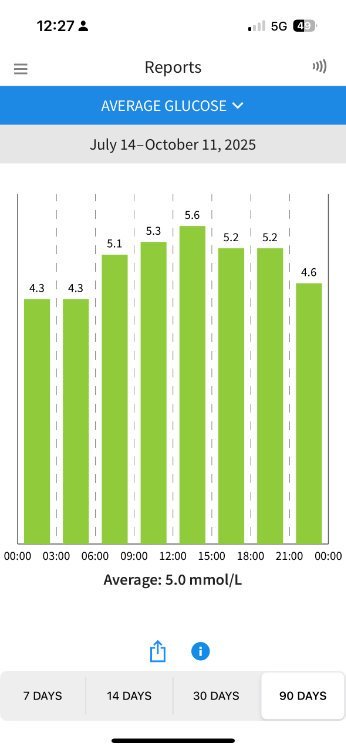
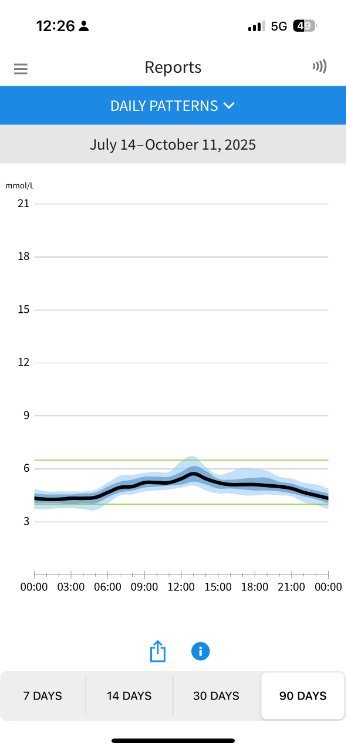
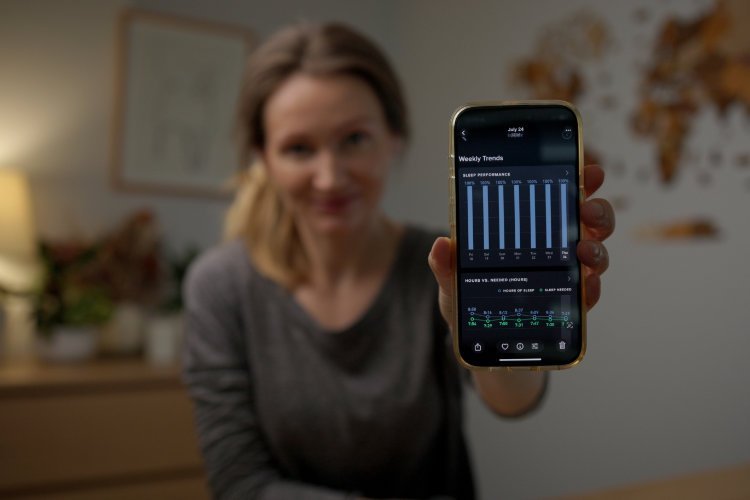
Below are screenshots from a fitness wearable I used at the time, along with continuous glucose monitor (CGM) data and my DEXA scan. They helped me track progress and stay accountable.
I started tracking fitness with a wearable at the end of June 2025.
That’s when I added zone 4–5 running and increased my overall training volume. Before that, progress was slower because strength training was limited by a frozen shoulder.
| Biomarker | June → October | Why it Matters |
|---|---|---|
| Resting heart rate (RHR) | 66 → 58 | Reflects how efficiently your heart and nervous system work at rest. A lower resting heart rate, typically below 60 bpm, is associated with stronger cardiovascular fitness, lower inflammation, and longer lifespan. |
| Heart rate variability (HRV)* | 48 → 78 | Measures how adaptable your nervous system is: your ability to recover and regulate stress. Higher or stable trends over time are associated with better cardiovascular health, greater stress resilience, and slower biological aging. |
| VO₂ max | 42 → 45 | Reflects how efficiently your body delivers and uses oxygen. Higher levels are linked to substantially lower risk of disease and early death, which is why VO₂ max is often considered one of the strongest longevity-related fitness markers. |
*HRV is highly individual. Baseline varies widely from person to person, and it can be influenced by sleep, hydration, stress, hormones, training load, temperature, and illness. It’s best viewed as a trend, not a single number.
In general, if it stays fairly steady or trends upward, that’s a good sign. If it trends downward for a while, it can be a sign that the body is under more strain or not recovering as well.
Stable blood glucose helps reduce oxidative stress, glycation, and vascular damage, processes that can speed up metabolic aging.
Consistently good glucose control also supports lower inflammation and helps protect blood vessels and brain function over time.
My average glucose (Jul 14–Oct 11, 2025): **5.0 mmol/L**
What better control looks like
After eating, blood sugar will rise. The question is how high, and for how long.
7.8 mmol/L is a commonly used upper limit, but many longevity-focused experts aim lower. My own target is to stay near 6.7 mmol/L.
So what do I actually do for sleep, exercise, and diet to get here?
Below are the habits I follow to support healthy aging and slow age-related decline:

I train six days a week with a mix of cardio and strength, and take one recovery day for a 60-minute walk.
I do regular aerobic training to support cardiovascular fitness, using a mix of running and other forms of cardio.
I train the major muscle groups several times a week to maintain strength, muscle and physical capability.
I include flexibility and mobility work in my warm-ups and cool-downs.
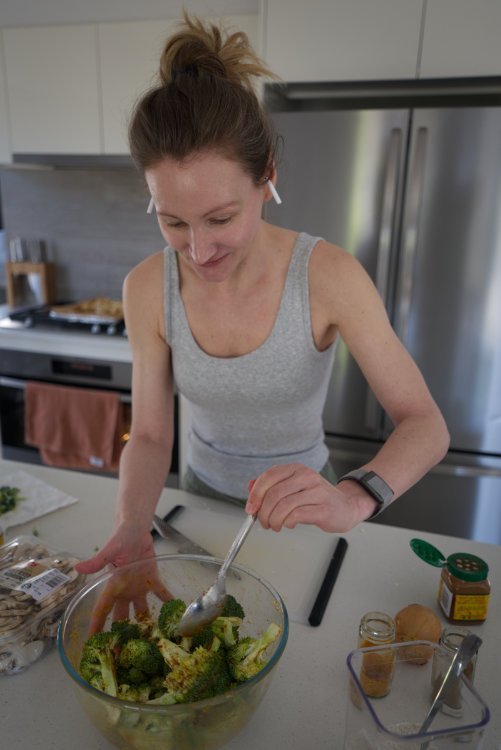
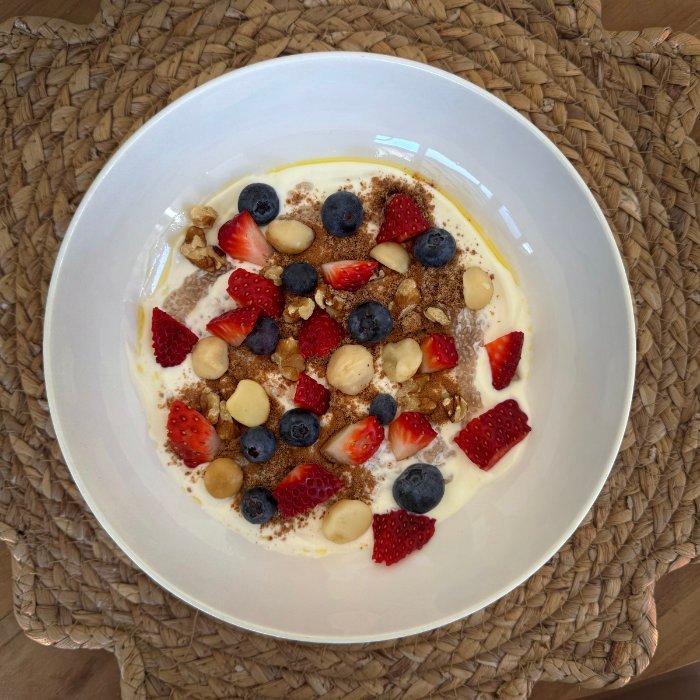
with flaxseed oil, flax meal, soaked chia seeds, Brazil nuts, macadamias, walnuts, cinnamon, and berries.
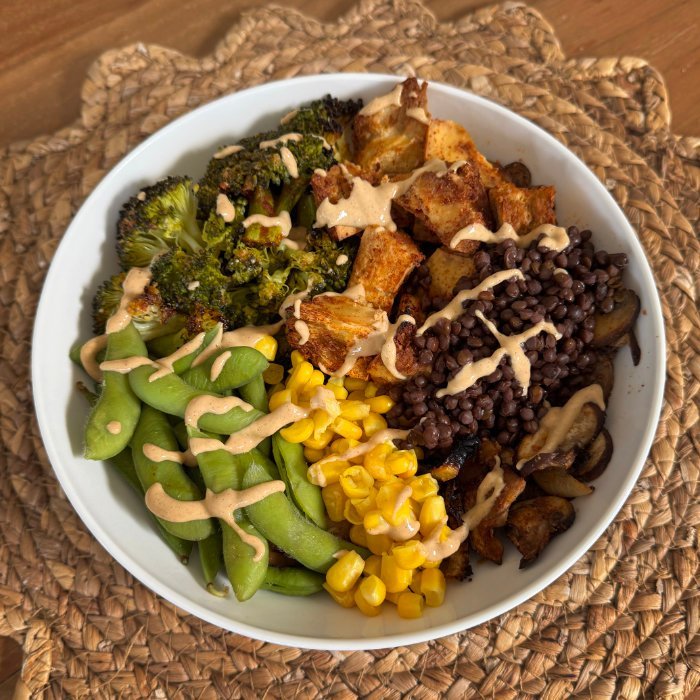
Broccoli, mushrooms, onion, black lentils, edamame, corn, tofu.
Dressing: tahini, lemon, garlic, olive oil, apple cider vinegar, smoked paprika.
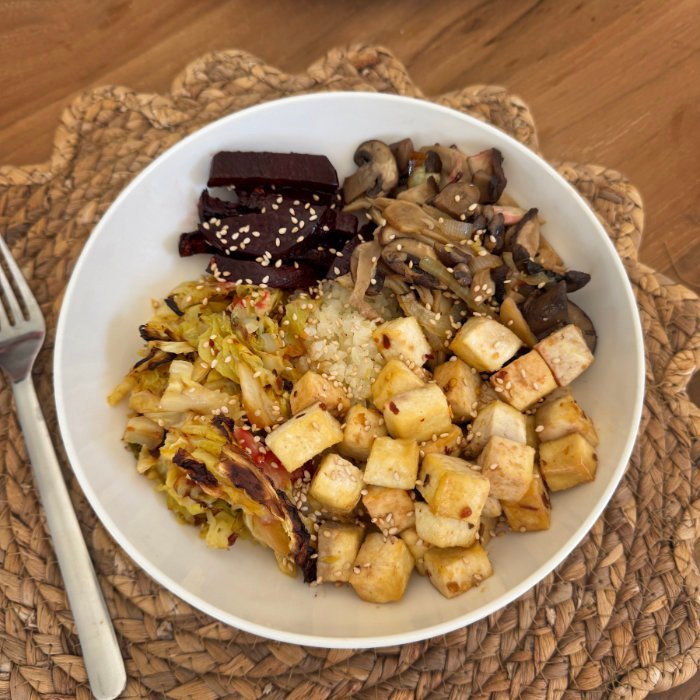
Beetroot, mixed mushrooms, cabbage, onion, ginger, tofu, cauliflower rice.
Sauce: tamari, rice vinegar, sesame oil, garlic. Topped with toasted sesame seeds and chili flakes.
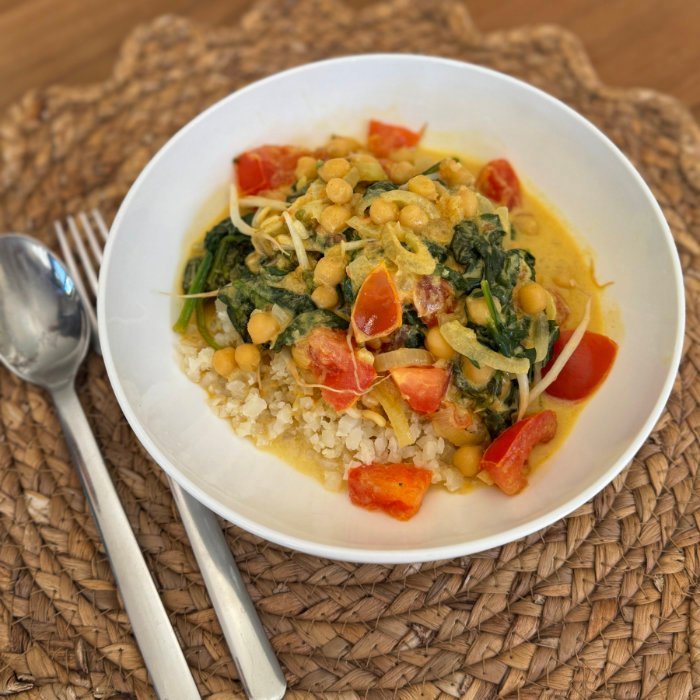
Spinach, chickpeas, tomato, onion, garlic, bean sprouts, ginger, coconut milk, cauliflower rice.
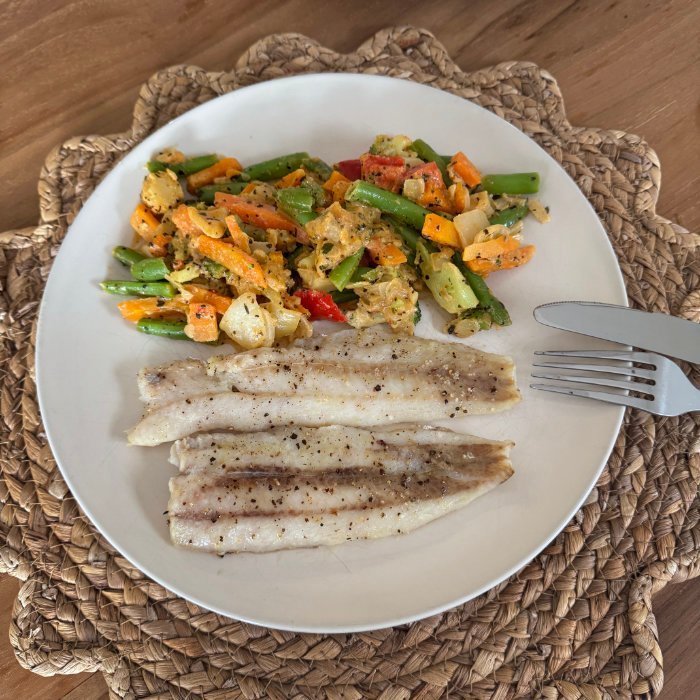
Fish served with frozen mixed veggies and a little thick cream.
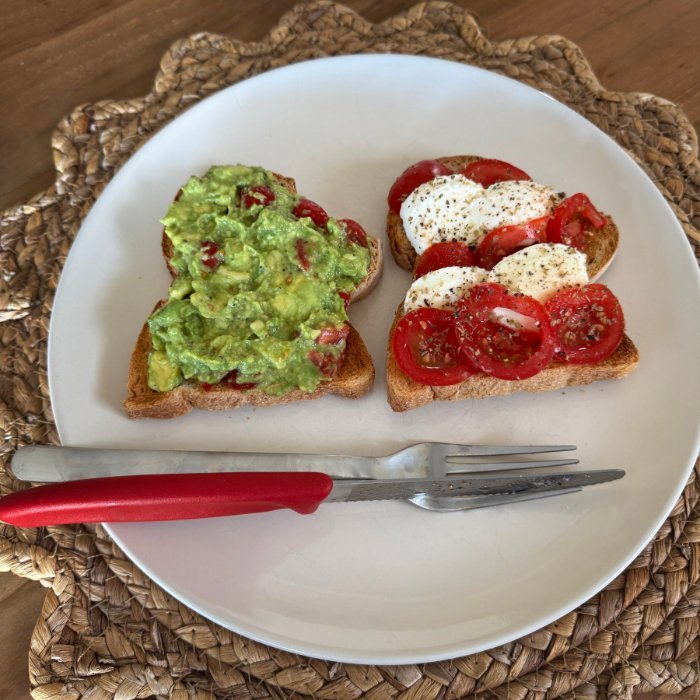
Avocado, tomato, mozzarella, wholemeal toast, olive oil.

Avocado, tomato, mozzarella, wholemeal toast, olive oil.